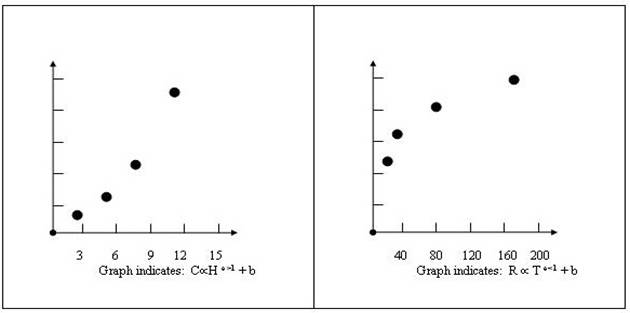
Direct Relation (Variation)
between Two Variables
A direct relation between two variables is when one variable ( independent )
increases and causes another variable ( dependent ) to increase.
All other vaiables are held constant when IV is Inc or Dec to view impact on DV.
In contrast, when the initial ( independent ) variable decreases and causes
the second ( dependent ) variable to decreases in an similar manner.
In other words, the dependent variable varies directly
as the independent variable when it increases or decreases.
To verify a direct relationship between two variables assuming
there is a direct relationship then a table of values needs to be collected.
Graphing collected results allows for a determination
and a visual analysis of provided or gathered data.
@ It is essential for understanding to use variables not X & Y!
|
H |
C |
|
|
T |
R |
|
2 |
24 |
|
|
169 |
23 |
|
5 |
45 |
|
|
81 |
19 |
|
7 |
69 |
|
|
36 |
16 |
|
11 |
141 |
|
|
9 |
13 |
Viewing the collected data in tables above the following conclusions are drawn.
Note: H (IV) decreases thus C (DV) decreases Note: T (IV) decreases thus R (DV) decreases

Thomas E. Love
Malone College Spring
2007
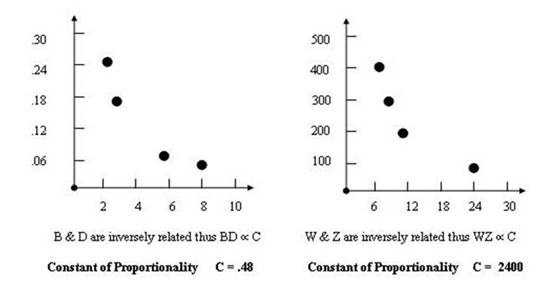
Inverse Relation (Variation)
between Two Variables
A inverse relation between two variables is when one variable ( independent )
increases and causes another variable ( dependent ) to decrease..
All other vaiables are held constant when IV is Inc or Dec to view impact on DV.
In contrast, when the initial ( independent ) variable decreases then it causes
the second ( dependent ) variable to increases in opposite values.
To establish a inverse relationship between two variables assuming there is
a inverse relationship then a table of values need to be collected.
Graphing the collected results allows for a determination
and a visual analysis of the provided or gathered data.
This is Inverse Relation is a common test item on Student Achievement Tests!
|
B |
D |
|
W |
Z |
|
2 |
.24 |
|
400 |
6 |
|
3 |
.16 |
|
300 |
8 |
|
6 |
.08 |
|
200 |
12 |
|
8 |
.06 |
|
100 |
24 |
Viewing the collected data in tables above the following conclusions are drawn.
Note: B (IV) increases thus D (DV) decreases Note: W (IV) decreases thus Z (DV) increases
|
|
Provide examples and assignments with results then
assign problems with C of P not
exact as in Real World!
Thomas E. Love
Malone College Spring 2007